Top 10 Healthcare Spending Categories in the United States
Many of the highest healthcare pending categories in the US continued to climb as indicated by significant growth in expenditure amounts.

Source: Thinkstock
- The upward trajectory of US healthcare spending doesn’t seem to be slowing down anytime soon, leaving payers, providers, and beneficiaries wondering how to control costs while maintaining a high level of quality.
Value-based contracting has started to slow the growth curve, but the industry still spends $3.2 trillion on a wide variety of services, according to the latest data from CMS and the CDC.
What were the top healthcare spending categories in the United States in 2015, the most recent year for which data is available, and what can payers expect to continue spending over the next few years?
Hospital care
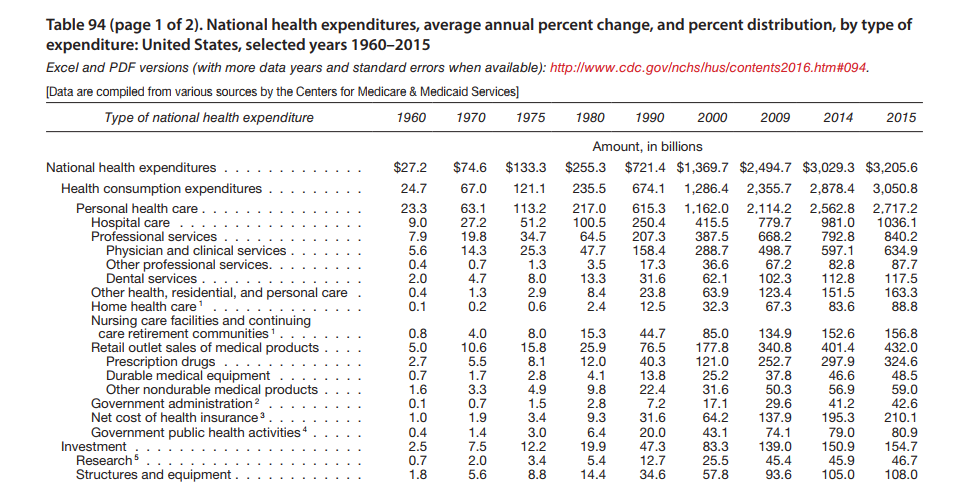
Spending for hospital care in the United States grew to a total of $1 trillion dollars in 2015, accounting for 32 percent of the country’s total healthcare spending.
Hospital spending experienced a growth rate of 5.4 percent in 2015 from the previous year, which is an increase of a growth rate of 4.9 percent throughout 2014.
“Hospital services, from a payer perspective, experienced faster growth in Medicaid and private health insurance spending; however, this strong growth was slightly offset by slower growth in Medicare hospital spending,” CMS said.
Physician care
In the US, 20 percent of all healthcare costs originated in the ambulatory physician and clinical services environment. The growth rate for these services jumped 6.3 percent in 2015 from the previous year, and totaled $634.9 billion.
CMS states that the 6.3 percent growth rate has been caused by inflation and other non-price factors.
Prescription drug spending
The cost of prescription drugs accounted for 10 percent of healthcare costs in 2015, or $324.6 billion.
The growth rate was higher in 2014 at 12.4 percent from the previous year, but the cost of pharmaceuticals still grew faster than any other sector of spending
Source: CDC
Residential and personal care
Healthcare spending on services associated with residential and personal care services accounted for 5 percent of US healthcare costs, totalling$163.3 billion.
The growth rate of spending on residential care services shot up to 7.8 percent in 2015 from the previous year, compared to a growth rate of 5 percent in 2014 from the previous year, which may be a result of more beneficiaries requiring residential healthcare services.
Fifty-seven percent of this spending was incurred by Medicaid. The program’s total spending on these services grew by 10 percent in 2015 from Medicaid spending in 2014.
Nursing facilities
Nursing facility spending totaled $156.8 billion and accounted for another 5 percent of national healthcare spending. These services include freestanding care facilities and continuing care retirement communities.
The growth rate of these services was mainly attributed to faster growth in Medicare spending, which jumped to 5.6 percent in 2015 from the previous year compared to a 2.5 percent growth rate in the previous year in 2014.
Dental services
Dental services spending accounted for 4 percent of US healthcare spending, totaling $117.5 billion in 2015.
This sector of healthcare services also grew at a rate of 4.2 percent in 2015 compared to 2.4 percent in the previous year.
Out-of-pocket spending accounted for 40 percent of spending and grew by 1.8 percent. Private health insurance spending on dental services also increased by 3 percent in 2015.
Sub-specialty professional services
National healthcare spending for independent health practitioners that provide physical therapy, optometry, podiatry, or chiropractic medicine reached $87.7 billion in 2015 and accounted for 3 percent of national healthcare spending.
The growth rate of healthcare spending in this sector grew marginally from 5.1 percent in 2014 to 5.9 percent in 2015.
Home health services
Spending on home healthcare agencies accounted for 3 percent of all US healthcare spending, and totaled $88.8 billion dollars in 2015.
Home health services spending grew at a rate of 6.3 percent, and was driven by Medicare and Medicaid, the largest purchasers of home health services.
“Stronger growth in both Medicare (2.6 percent) and Medicaid (6.0 percent) spending -- the two largest payers which accounted for 76 percent of home health spending -- along with faster growth in private health insurance and out-of-pocket spending drove the overall acceleration in 2015,” CMS said.
Durable medical equipment
Spending on devices such as contact lenses, eyeglasses, hearing aids, wheelchairs, and walkers totaled $48.5 billion in 2015 and accounted for 2 percent of all healthcare spending in the nation. The growth rate on spending remained constant in this category, slightly jumping from 3.5 percent in 2014 from the previous year, to a growth rate of 3.9 percent in 2015 compared to 2014 spending.
Other nondurable medical products
Nondurable medical product spending on over-the-counter medicines, medical instruments, surgical dressings, and similar items grew by 3.7 percent to $59.0 billion in 2015 in the previous year. The growth rate for spending on these products decreased from 6.9 percent in 2014 in the previous year.